The End of TINA and The Beginning of Alternative Income Options
Several years ago I had a checking account that paid 4% interest on the money I had in that account. To get that rate, I had to jump through several hoops including setting up direct deposit of funds into that account, completing 10 debit card transactions each month, etc. The interesting thing with this 4% rate was that it matches the 4% withdrawal rate financial advisors often recommend to clients who have retired. If the portfolio were to grow at an after-tax rate of greater than 4%, then the client would not have to tap into principal for expenses and the portfolio could grow to keep up with inflation. We discussed some of this in our What’s Your Number? series of articles here, here and here.
As time progressed, the rate I was receiving on that checking account came down just as we saw with other interest yielding instruments including CDs, preferred shares and bonds. Investors flocked en masse to stocks and especially dividend paying stocks. They felt that there is no alternative (TINA) and stocks could help with both capital appreciation and throw off some income. Dividend growth stocks were a particularly popular sub-segment, as they provided exposure to companies that not only paid a dividend but increased those dividends year after year and sometimes decade after decade. Dividend Aristocrats were companies that had increased their dividends for 25 consecutive years, which was a tall order considering the last 25 year period encompassed the 2001-2003 bear market, the 2008-2009 Great Recession and the COVID-19 pandemic.
Dividend Kings went one step further and consisted of companies that had increased their dividends for 50 consecutive years. There were only 37 companies that made the cut for inclusion in this rarified group in 2022 including names like Coca-Cola (KO), Colgate-Palmolive (CL), Sysco (SYY) and Hormel Foods (HRL). Investors could easily get exposure to the Dividend Aristocrats through the SPDR S&P Dividend ETF (SDY) or the ProShares S&P 500 Dividend Aristocrats ETF (NOBL) but there is no ETF dedicated to the Dividend Kings that I am aware of.

With the rapid increase in interest rates this year, the TINA trade is finally coming to an end. Investors that had moved assets to dividend stocks or REITs for their yield have started transitioning away to other instruments that provide better returns. In some cases those instruments, like my high interest bearing checking account, provide returns with almost no risk to capital. It certainly does not help that despite the 17% year-to-date drop, NOBL only yields 2.18% and this is before the 0.35% expense ratio for the ETF.
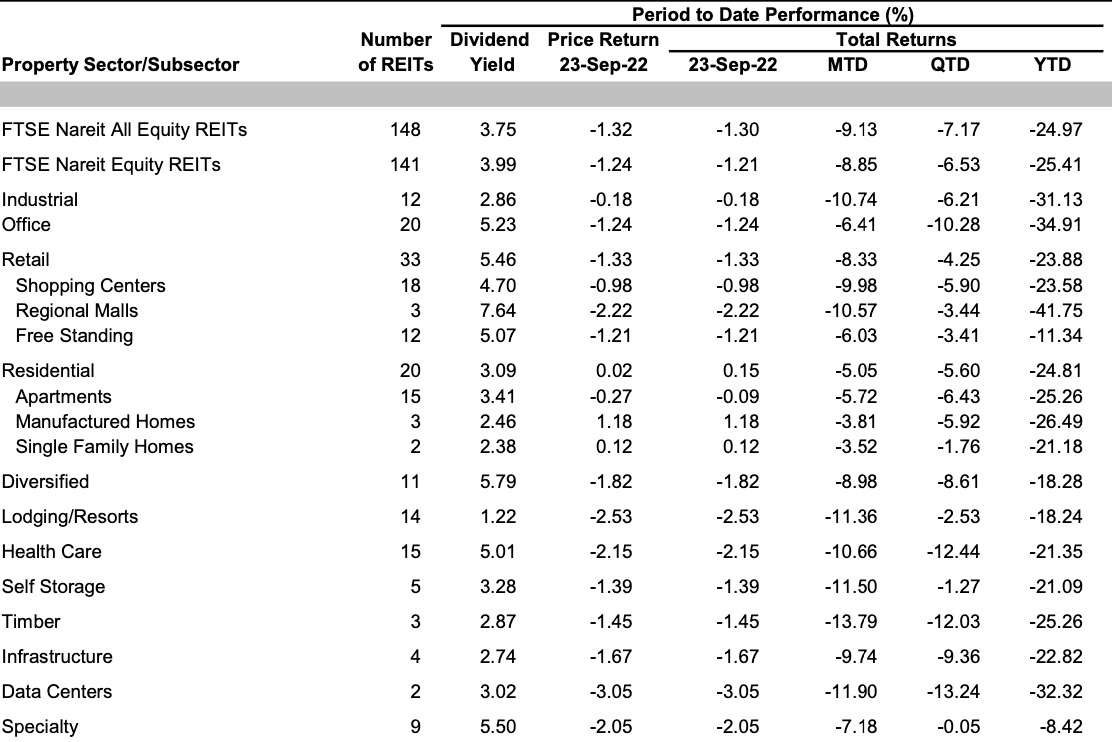
The other asset class that yield hungry investors flocked to was real estate investment trusts or REITs. The Vanguard Real Estate ETF (VNQ) with nearly $35 billion in assets is down more than 28% year-to-date. The drop in the value of REITs has helped the yield of all equity REITs trend up to 3.99% (as of September 23, 2022). There is obviously quite a bit of variability in the yields offered by various sub-sectors as you can see from the table below (provided by NAREIT).

Some of these REIT sub-sectors are starting to look interesting and I am watching a diversified REIT that was a spotlight idea in our September 2022 Special Situations Newsletter closely. While REIT yields are up, we are not at a point where increasing exposure to REITs makes sense because of some fundamental headwinds they face. After years of refinancing their debt at lower interest rates, they will now have to refinance at higher rates. Unless they have pricing power in the markets they operate in, this could translate into lower payouts.
Considering two key asset classes are not viable at the moment, where should investors look for yield?
- Shorter duration treasury bills and notes. The yield curve has inverted with shorter duration bonds that mature in a few months or years yielding more than longer duration bonds. For example, the 2 year U.S. treasury note now yields 4.3% compared to 3.97% for the 10 year treasury note. Considering interest rates are expected to rise, shorter duration treasury bills (those with duration of less than a year) might make more sense. The three month treasury bill now yields 3.29% and the six month treasury bill yields 3.92%. The iShares Treasury Floating Rate Bond ETF (TFLO) consisting of 8 different treasury bonds could be a worthy contender. It has a 3.07% yield, a 0.15% expense ratio and average maturity of 0 to 1 year for 80% of its portfolio. The Vanguard Short-Term Treasury ETF (VGSH) with a 3.5% yield to maturity, a 0.04% expense ratio and an average duration of 1.9 years also appears to be a good option if you want to go out a little on duration.
- Bank CDs. After a long dry spell with certificates of deposits yielding next to nothing, they are back. First Republic (FRC) has a 4 month CD that yields 3.5%. As time progresses and depositors start leaving banks for greener pastures, we can expect to see more banks offering attractive rates on CDs. Setting up CD ladders with different duration CDs that expire every few months will be helpful in this environment.
- I-Bonds From TreasuryDirect.gov. The current rate on new Series I savings bonds is 9.62%. However there are several nuances to this rate that are important to understand. The rate is a composite rate consisting of a fixed rate and a semiannual inflation rate. The fixed rate is currently 0% and the semiannual inflation rate is 4.81%. The exact formula used to calculate the rate is given below. The semiannual inflation rate will change every six months. You can only purchase a maximum $10,000 worth of I-Bonds directly from TreasuryDirect.gov per social security number and certain entities like trusts, corporations, partnerships, etc. There is no secondary market for these 30 year I-Bonds but they can be redeemed after 12 months with a three month interest penalty or after five years with no penalty. I would highly recommend checking out this comparison table between TIPS and I-Bonds to understand these nuances and the tax implications (deferred taxes, no state/local taxes, etc.).
Composite rate = [fixed rate + (2 x semiannual inflation rate) + (fixed rate x semiannual inflation rate)]
Composite rate = [0% + (2 x 4.81%) + (0% x 4.81%)] = [0% + 9.62% + 0%] = 9.62%
- Preferred shares. Preferred shares sit between common stocks and bonds on the capital structure. They don’t move much in price (they have a fixed “par” value like bonds) and usually have a higher dividend yield. If the company is in trouble, it will first cut the dividend for common stock before it cuts the preferred share dividends. So you end up with better yields but no participation in equity upside. In case of bankruptcy, they are below bonds in the totem pole. I usually like to buy them during times of market turmoil when their prices drop and the yield improves. You can either buy preferred shares for individual companies or through a diversified ETF like iShares Preferred and Income Securities ETF (PFF) that holds preferred shares of 500 different companies including Bank of America (BAC), Danaher (DHR), Ford Motor (F), NextEra Energy (NEE), Broadcom (AVGO), etc. The 30 day SEC yield as of August 30, 2022 after deducting fund expenses (0.45%) was 5.61%. During the last decade PFF saw its yield drop gradually over time as interest rates dropped and companies issued preferred shares with lower yields. This process is now reversing and we will likely see yield trend up for PFF, making it a good instrument to consider during sudden or extended market drops.
- Merger Arbitrage. Our favorite strategy at the moment on InsideArbitrage is merger arbitrage. The strategy applies to announced mergers and allows you to pick up the difference or “spread” between what a company is currently trading at and the price an acquirer is going to pay when the deal closes. For example, Activision Blizzard (ATVI) currently trades more than $20 per share below Microsoft’s acquisition price of $95 per share in cash. As you can see from our deal metrics page, the spread or return on this deal is over 27% or 36% annualized if the deal closes by the middle of next year. There are obviously risks embedded in the strategy and it is aptly also known as risk arbitrage. In the case of ATVI, the key risk is regulators like the Federal Trade Commission (FTC) stepping in and blocking the deal on competitive concerns. Just like preferred shares, spreads on mergers tend to increase during times of market turmoil making it an attractive hunting ground. Returns of anywhere from 5% to 20% annualized are possible depending on where on the risk spectrum you land and the specific deals you pick. I currently hold positions in seven arbitrage situations and plan to add one more after I publish our October 2022 Special Situations newsletter at the end of this week.
If you have an income generating strategy that works for you and that I have not covered in this article, I would love to hear from you.
Voluntary Disclosure: I hold a long position in PFF.