- Subscribe
- Premium
- C-Suite
- Insiders
- M&A
- Gurus
- Spinoffs
- Buybacks
- More
In our last article discussing the huge impact of inflation on your retirement plan I wrote,
When playing with the inputs that go into our What’s Your Number tool, I was struck by just how big of an impact two of those inputs had on the results. Just a small change could switch the eventual outcome from leaving millions of dollars for your heirs/charity to being without money in the later years of your retirement. One of those two factors was the expected rate of inflation during retirement.
Changing the rate of inflation in the tool from 2% to 4% changed the outcome from a projected surplus of $3.12 million at the end of my life to a steep shortfall of almost $3 million by the time I am 80 years old.
In case you missed it, you can read part 1 and part 2 of our Whats Your Number articles here and here.
Today I want to explore the other factor that can have a significant impact on the trajectory of a retirement plan. In our original What’s Your Number model, we assumed an 8% after tax rate of return on our investments. While this is optimistic, it is not out of reach, especially if a portfolio has significant exposure to equities and has several decades to smooth out the impact of volatility.
Deutsche Bank Research published a study in September 2020 called The Age of Disorder that discusses long-term asset returns and the results are fascinating. The two things that really jumped out at me from the study were the GDPs of various countries across two millennia and the long-term returns of various asset classes.
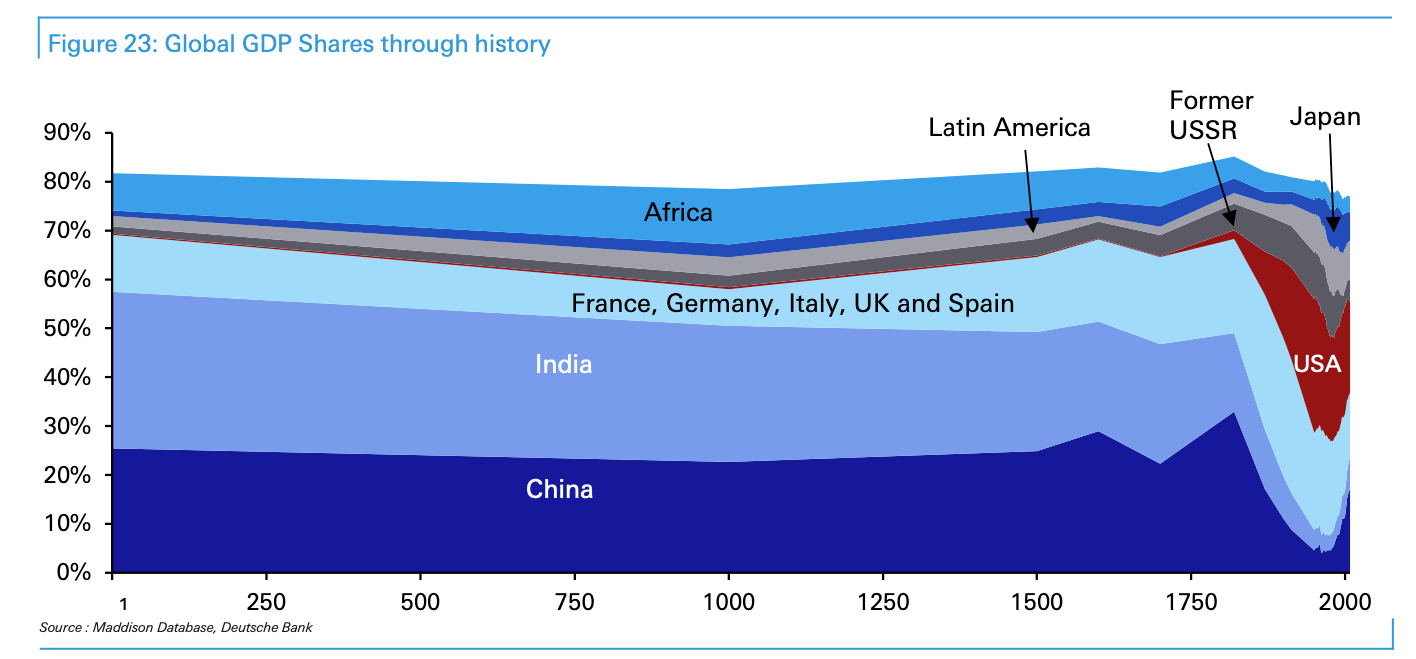 As you can see from the chart above, while India and China dominated global GDP for nearly 1,800 years, their share shrunk in the last 200 years and then started to rebound again in the last few decades. This trend is likely to continue in the future and should give anyone with a home country bias pause.
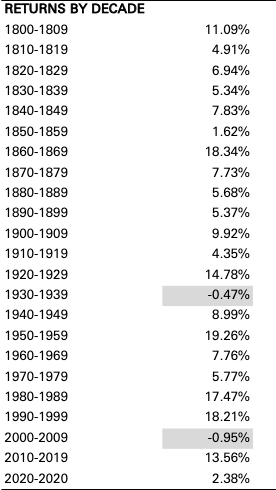
On pages 57 and 58 of this report, Deutsche Bank discusses the nominal and real annual returns of U.S. equities by decade, by each half century and since 1800. Nominal annual returns for U.S. stocks since 1800 were 8.61% per year and since 1900, they were 9.62%. However there was quite a bit of variability when you looked at the data by decades. As you would expect, the 1990s had excellent returns driven by the go-go era of the dot com bubble and annual returns during that decade were 18.21%.
Unfortunately investors that started investing in the next decade were not quite as fortunate and saw the annual returns drop to roughly negative 1%. The 2010s coming out of the Great Recession once again saw annual gains of 13.56%. You often saw decades with double digit returns followed by decades with either negative or single digit returns. The only exception since the 1920s was the decade starting in 1990, which followed annual returns of 17.47% in the 1980s.
After adjusting for inflation real returns were negative in three decades including the 1910s, the 1970s and the 2000s. Shockingly real returns were actually positive in the 1930s because of deflation during the Great Depression.
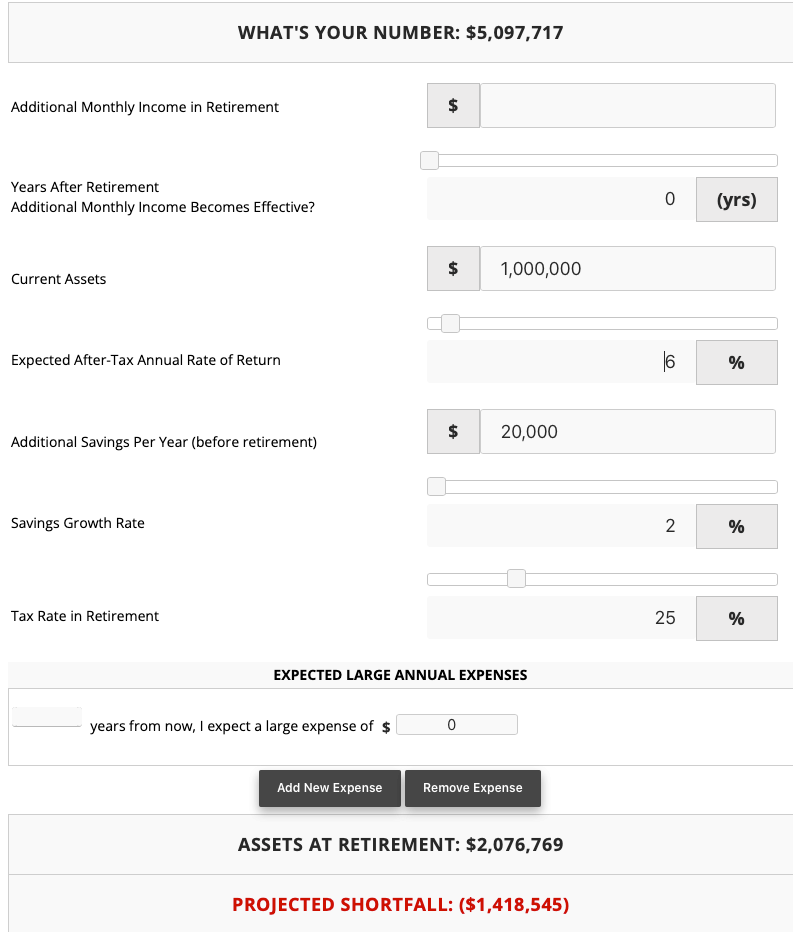
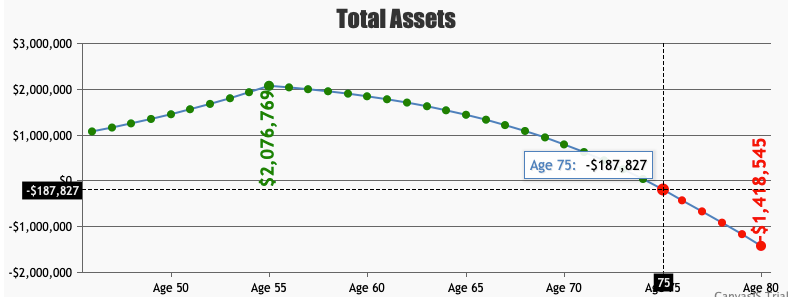
Getting back to our Whats Your Number tool, if we were to adjust our expectations of future returns from 8% annual after-tax returns down to 6%, while holding the rate of inflation at 2%, my assets at retirement drop modestly to $2.08 million from $2.47 million. However instead of leaving behind $3.12 million at the end of my life, I would be $1.42 million in the negative having run out of money at the age of 75.
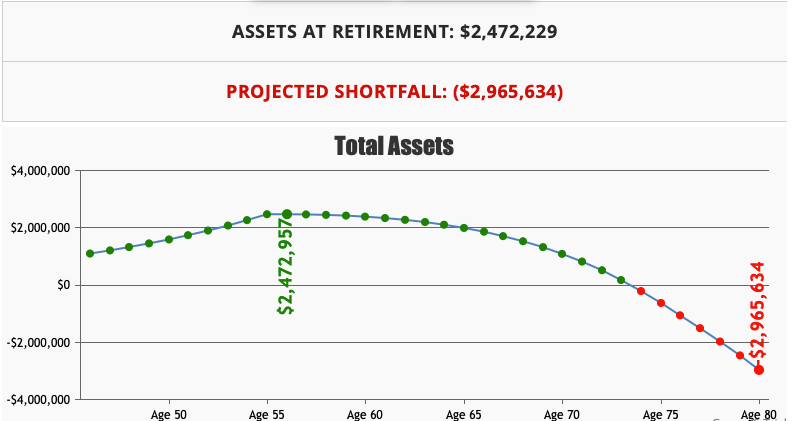
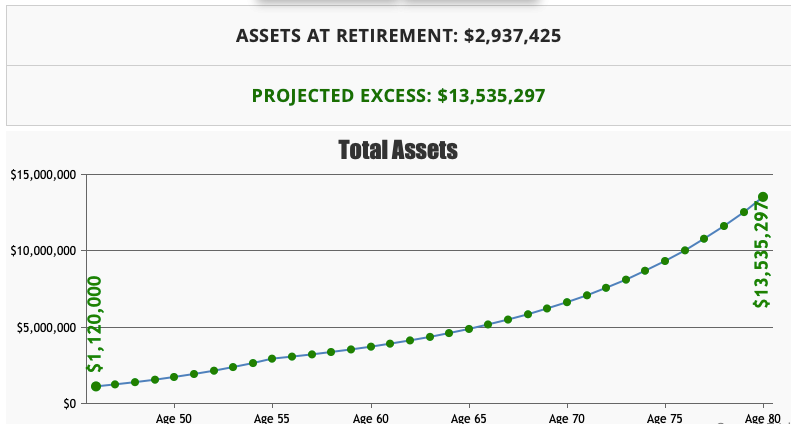
Adjusting the expected rate of return in the other direction with expectations of 10% returns per year, the picture changes completely. Instead of starting your retirement with $2.47 million in assets and leaving behind $3.12 million, your assets have grown to nearly $2.94 million by the time you retire and you leave behind $13.54 million in assets at the end of your life.
The key takeaways for me were,