
- Subscribe
- Premium
- C-Suite
- Insiders
- M&A
- Gurus
- Spinoffs
- Buybacks
- More
A few months ago we built a custom screen for premium members called Flip Floppers and described it as follows:
The Flip Flopper is a premium screen that identifies insiders who purchased and sold shares within a period of time. For example they purchased shares on January 3, 2023 and sold those shares by April 28, 2023. The screen also identifies insiders that were selling and then suddenly flip to buying instead.
Why is this important? The SEC does not want insiders to engage in short-term trading and requires them to give back any profits from trades that happened within a six month period.
This is called the “short-swing profit rule”. Section 16(b) of the Securities Exchange Act of 1934 states that if an insider of a public company buys and sells, or on the other hand sells and buys, stock of the company within a six-month period, they have to disgorge profits from these “matching” trades to the company.
The rule is used to discourage insiders from using the information they possess to make short-term profits. Every once in a while, we come across insider transactions where the insider indicates that the transaction violates the Short-Swing Profit rule and that the insider is going to return any profits from the prior trade back to the company. Flip flopping insiders are sending us a signal that they think the prevailing winds have changed and that they are willing to give up some short-term profits to make even more money down the road.
We decided to build the flip flopper screen to identify these insiders and allow you to filter by three different time periods from the “period” drop down.
The company we are briefly discussing this week is a flip flopper situation and we had to go beyond the top 5 insider purchases to identify it.
Xponential Fitness, Inc. (XPOF): $21.81
Business:
Xponential Fitness is a boutique fitness company that franchises brands focused on specialty fitness interests such as pilates, cycling, rowing and yoga.
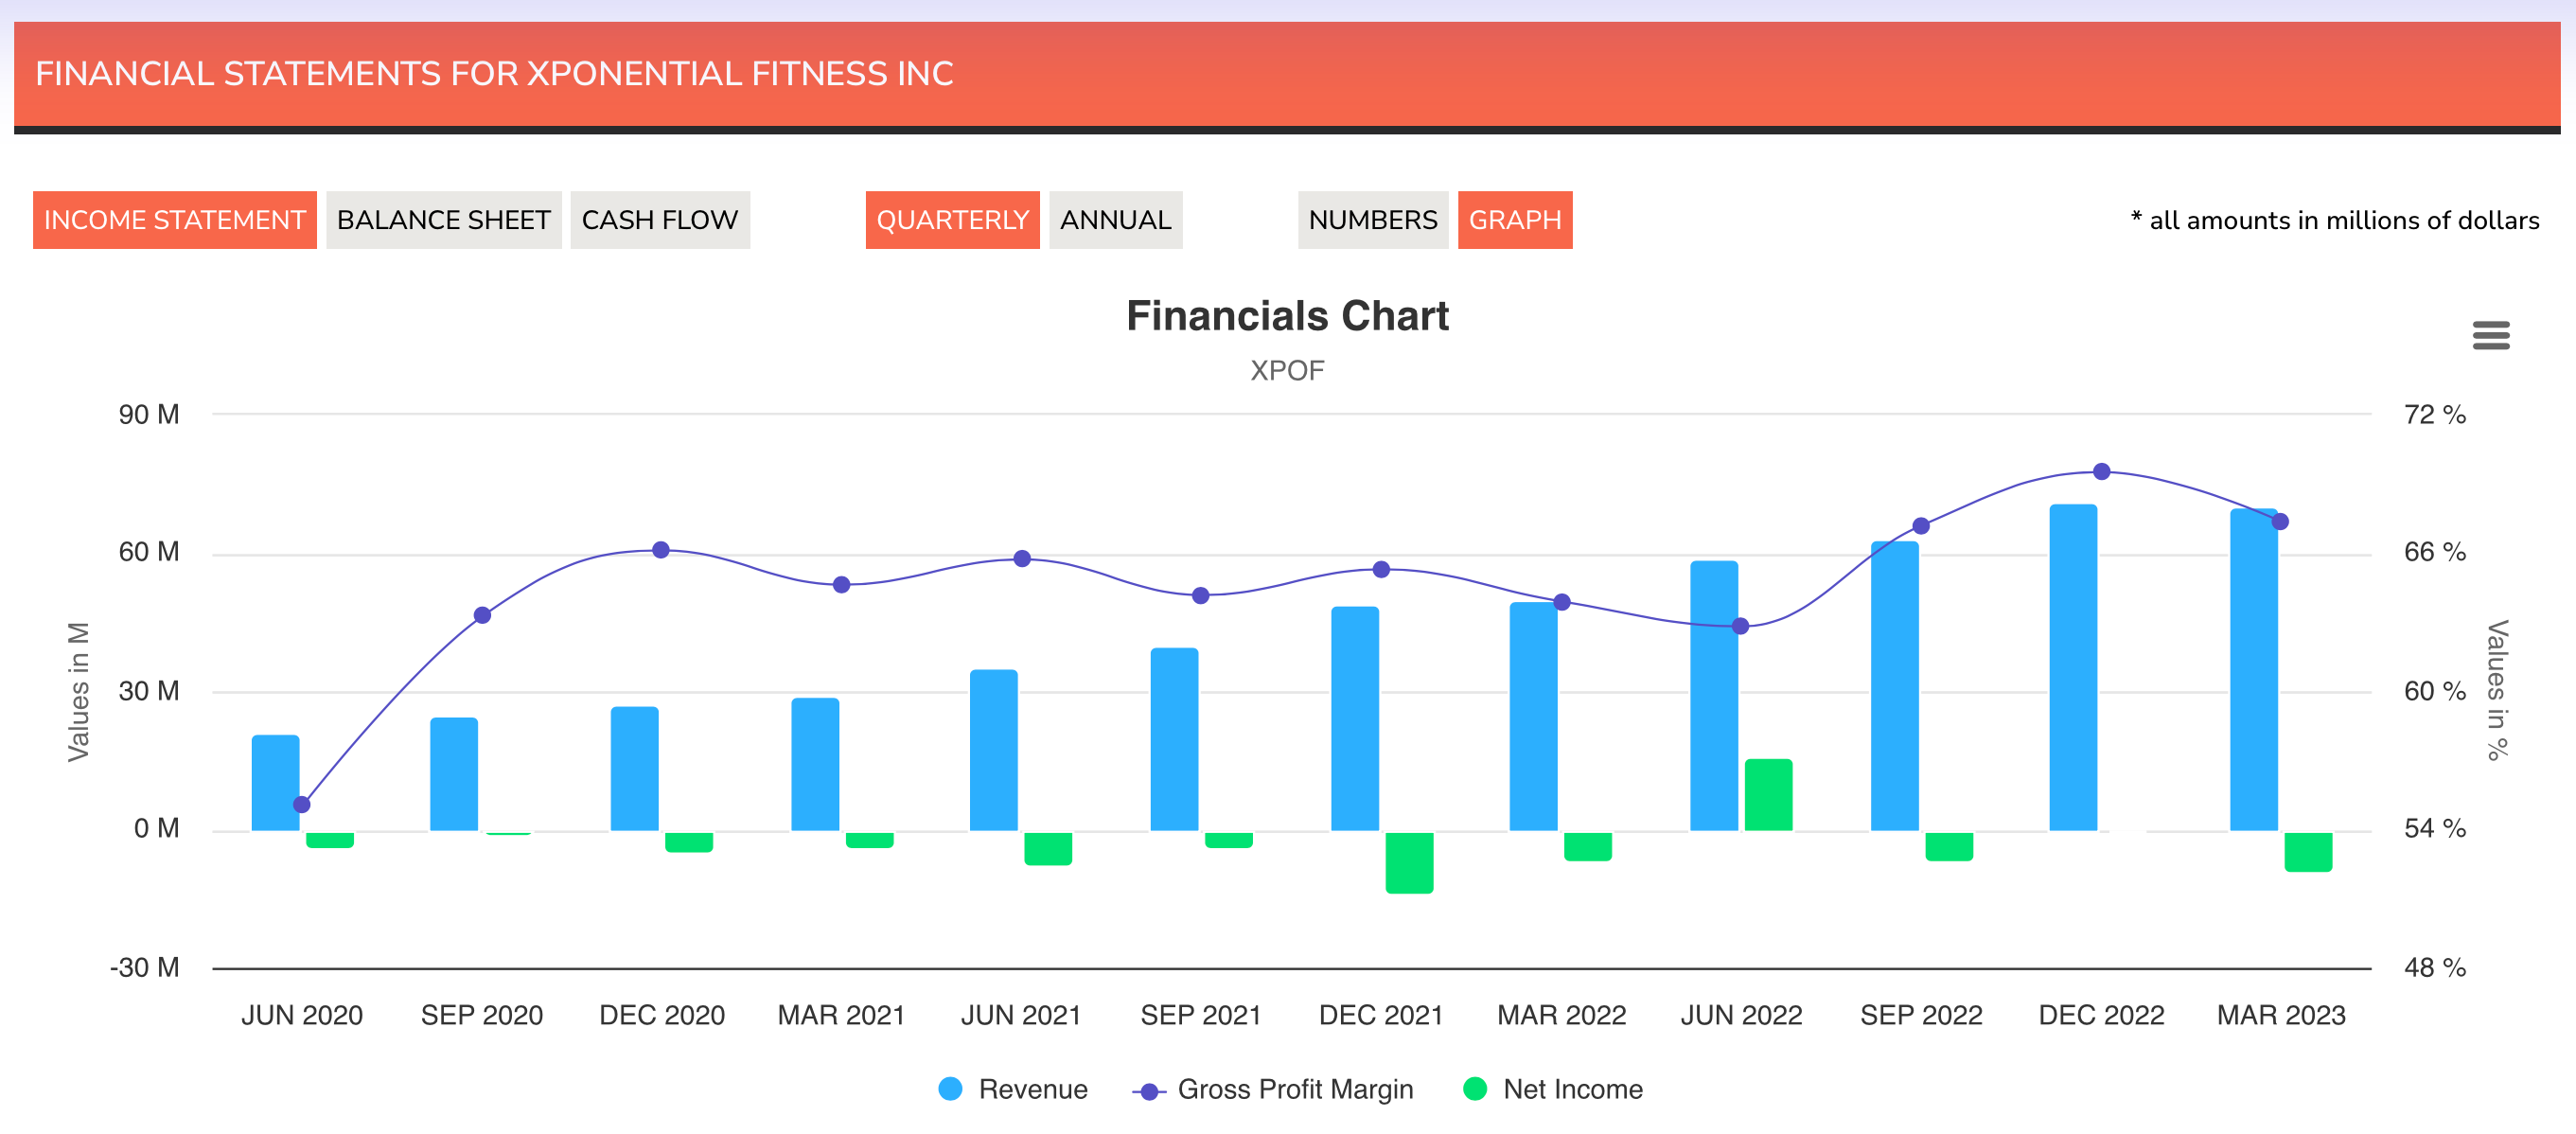
When I graphed the company’s income statement using the new InsideArbitrage financial statements graphing feature, I was surprised to see that the company’s gross margin was well above the gross margin of competitor Planet Fitness (PLNT) and more than double of Lift Time Group Holdings (LTH), which is having a second go as a public company after TPG and Leonard Green took it private in 2015.
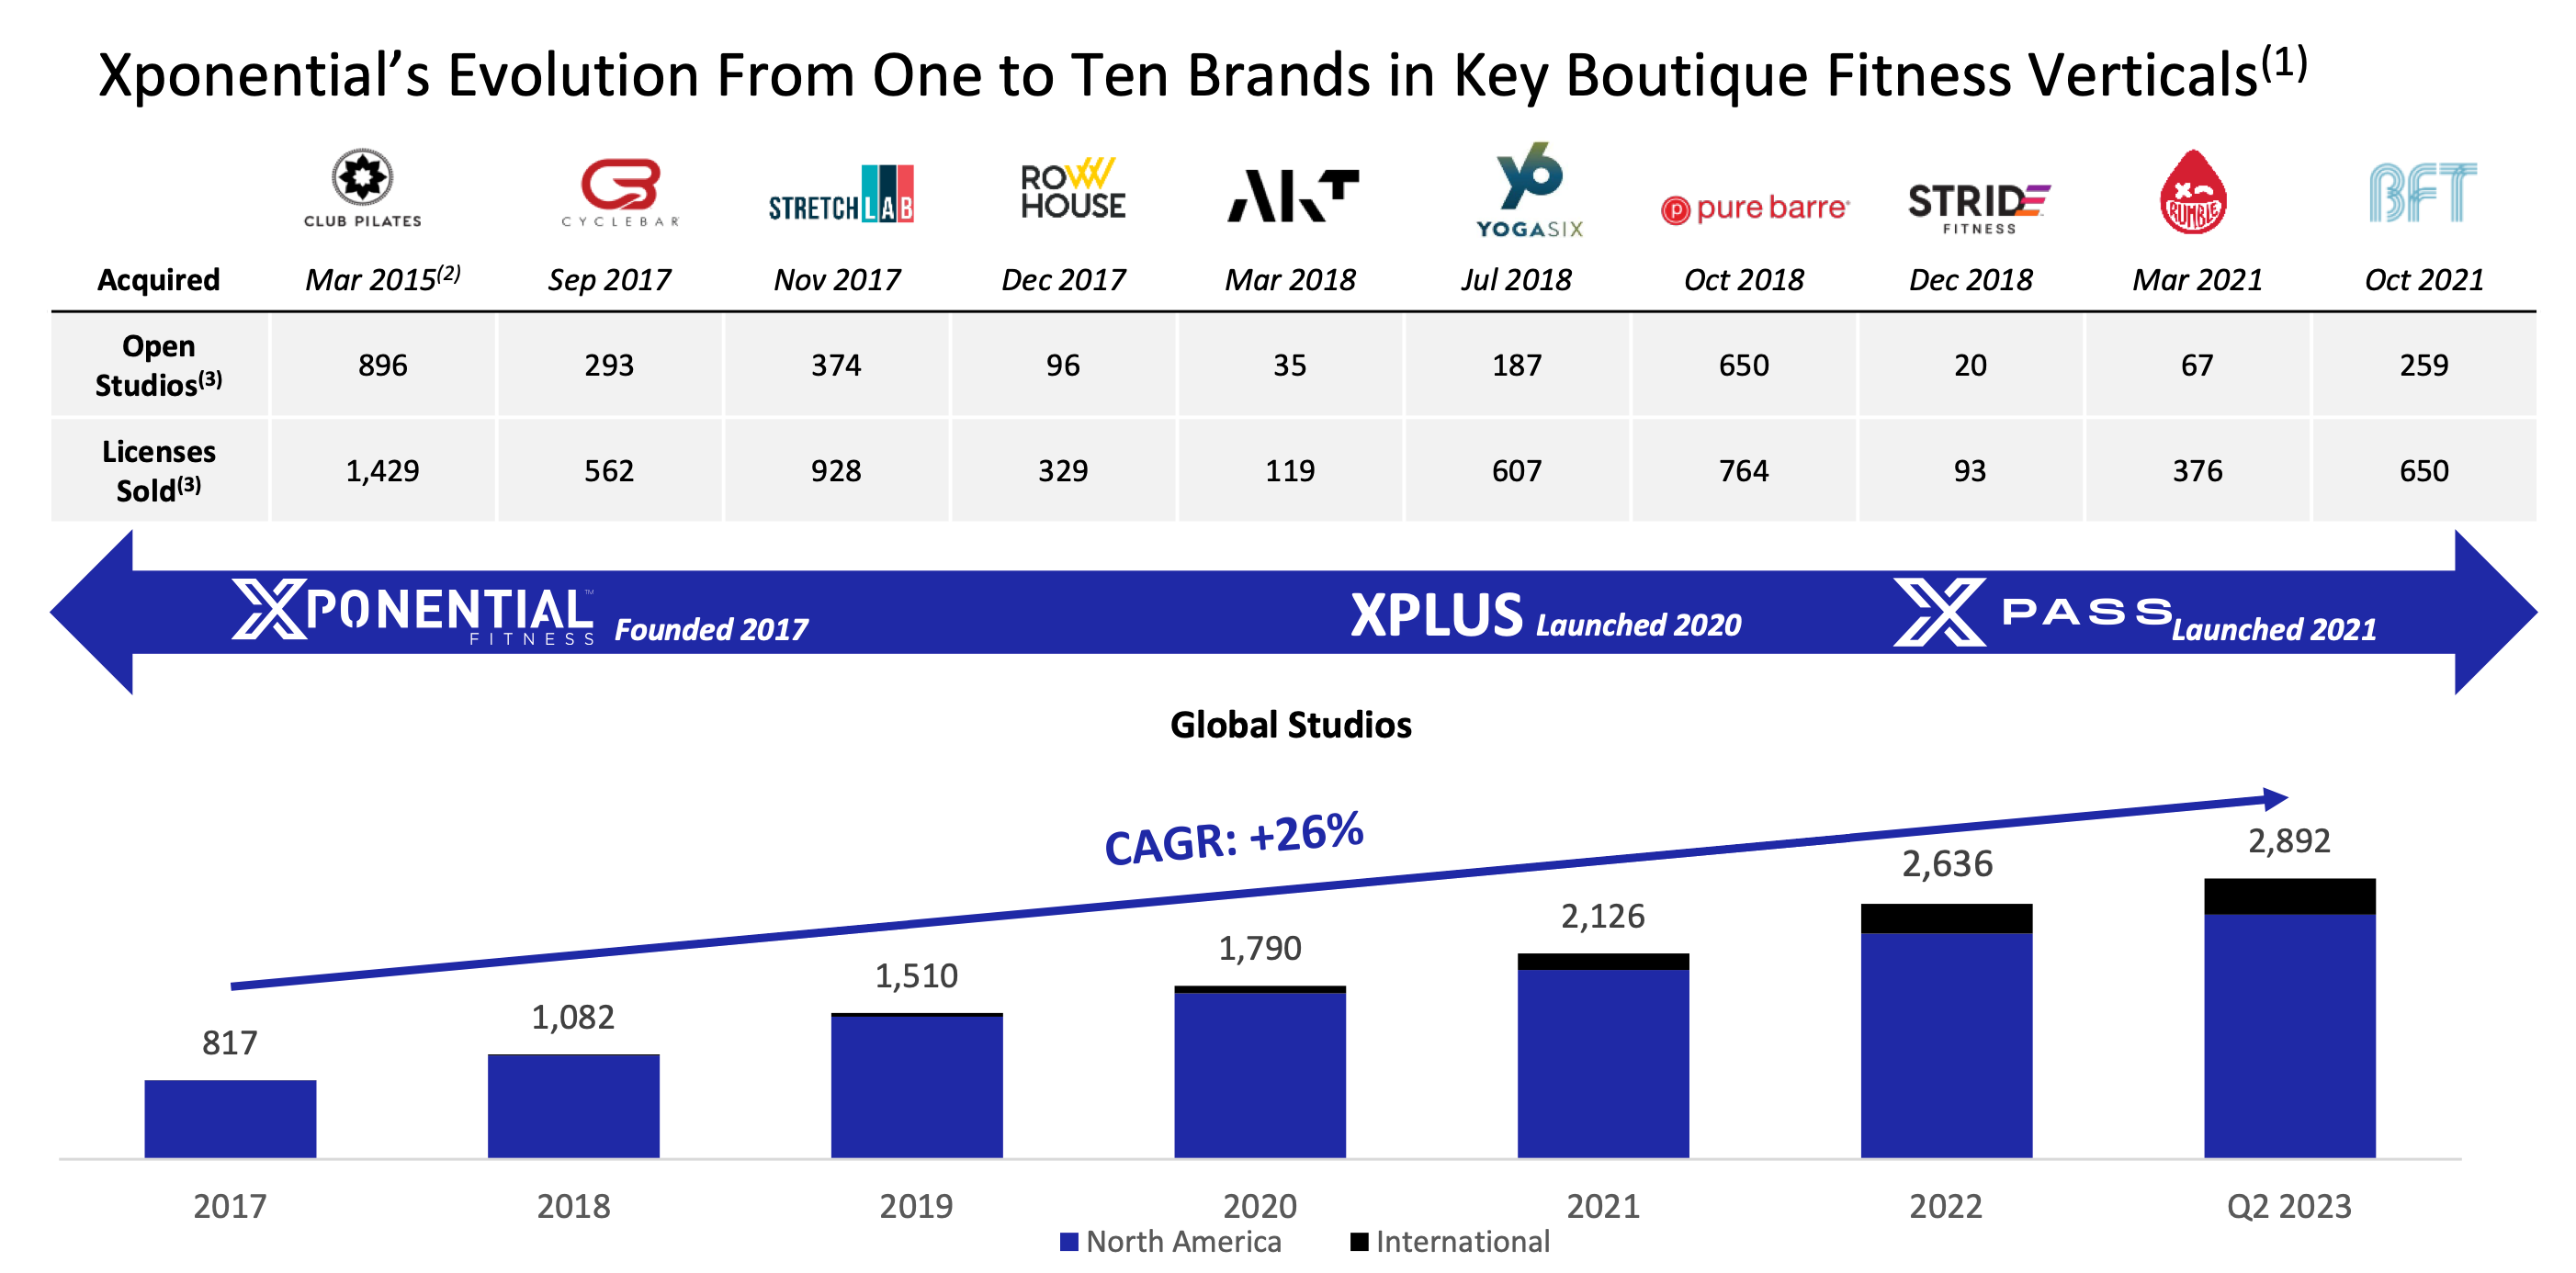
The high gross margin can be explained by the fact that Xponential Fitness is an asset-light franchising business with 2,850 fitness studios open across its 10 brands. Franchisees invest around $350,000 to get a fitness center up and running and can expect revenue of about $500,000 by their second year of operations at 25% to 30% operating margins.
I looked at the monthly membership costs at one of their YogaSix studios ($159/month), calculated the average number of members at their studios (242) and the top line revenue number of $462,000 comes close the expectations Xponential is setting for their franchisees. These are average numbers and it would mean that some franchisees are likely to earn less or potentially even generate losses. More on that later.
Growth and Outlook:
Xponential is positioning itself as a high growth company and hence net income is scant and the balance sheet is leveraged. Last quarter, the company grew revenue by 29.8% to $77.3 million and increased its full year revenue forecast to a range of $295 million to $305 million, indicating a 22% increase year-over-year if revenue comes in at $300 million. The company also edged up its adjusted EBITDA guidance to a range of $102.5 million to $106.5 million, or an increase of 41% at the midpoint compared to 2022.
Net income of $27.5 million on sales of $77.3 million seemed respectable but the majority of that was related to a non-cash mark-to-market adjustment related to an acquisition. Adjusted net income was $4.2 million or 5 cents per share.
Inside Buying:
Last week we saw a cluster of insiders including the CEO, the Chief Legal Officers and two directors purchase shares of Xponential Fitness.
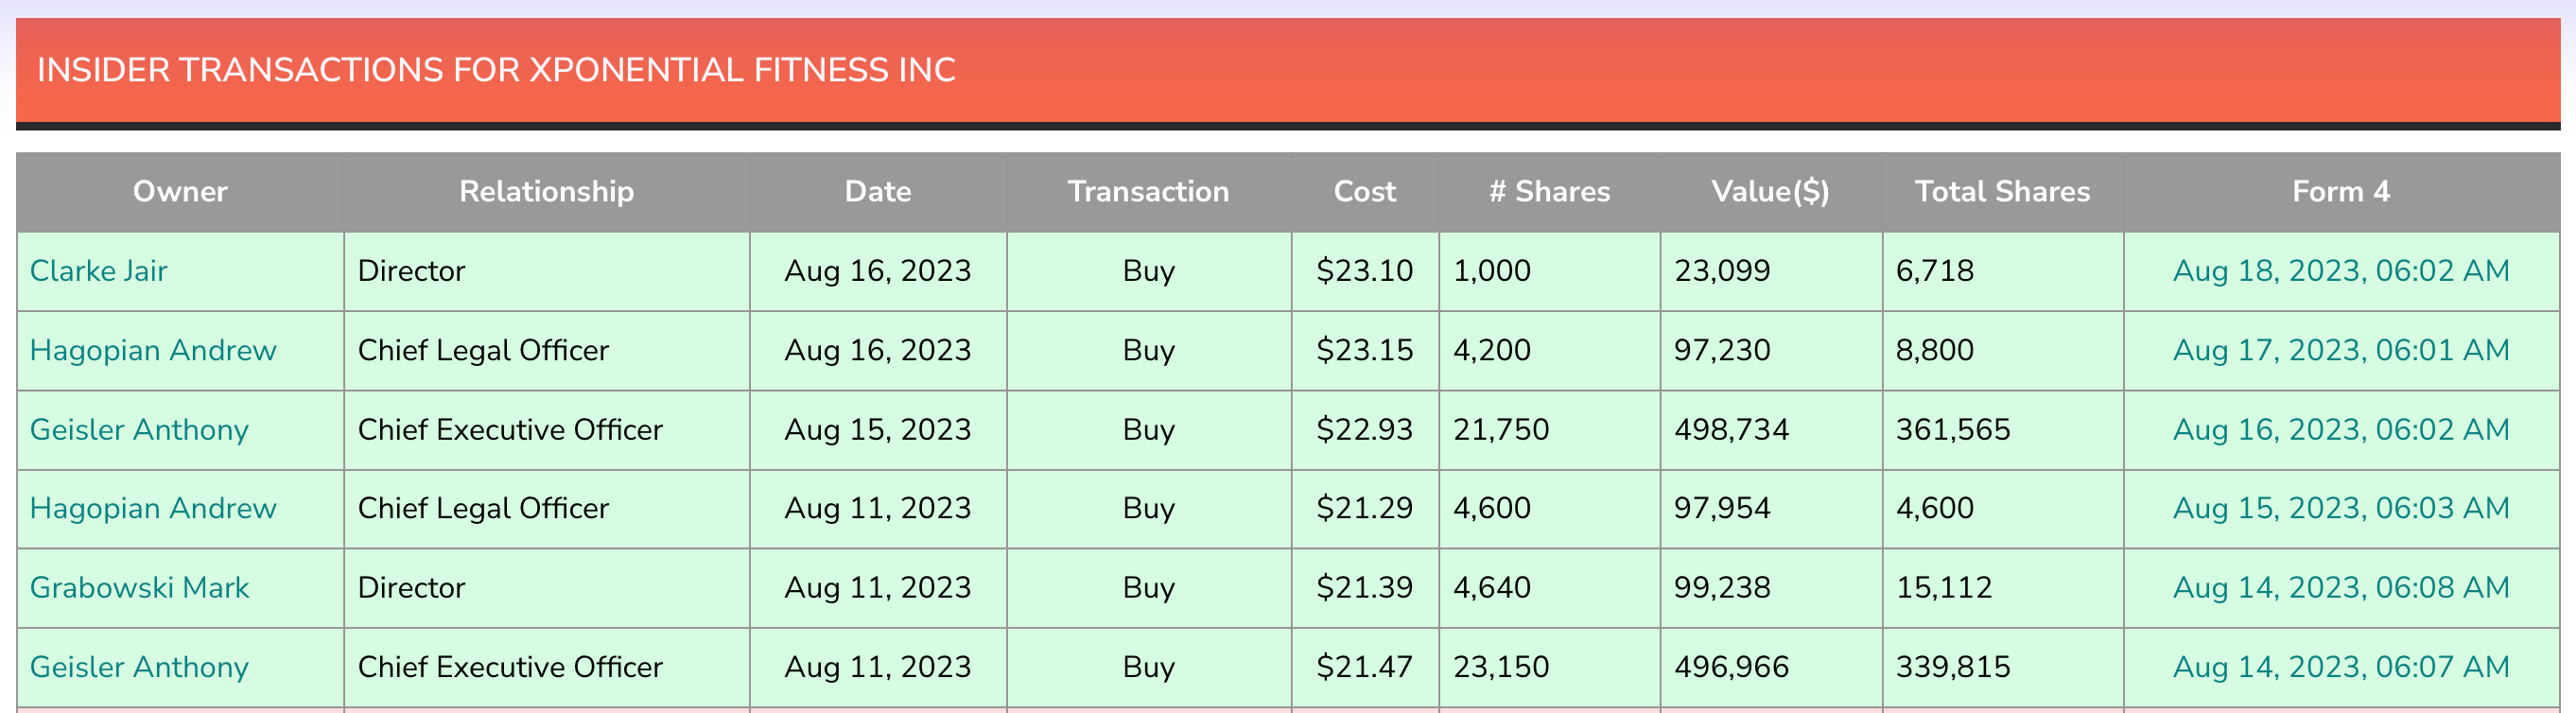
One of these insiders, the CEO, was a flip flopper and agreed to disgorge $225,845 of profits back to the company because some of his prior sales were within six months of this purchase. You can check out the footnote in this form 4 filing. The las time insiders were so bullish about the company was in July and September 2021 when the stock was trading in the $10 to $12 range, below the company’s July 2021 IPO price of $12.
Conclusion:
Xponential checked a large number of boxes in my mental checklist including a founder at the helm, a rapidly growing company that appeared profitable, free cash flow above reported net income numbers, raised guidance, insider buying and a buyback announcement to the tune of $50 million.
The big question was why did the insiders suddenly stop selling stock and started buying as a group, especially when it meant the CEO had to give nearly a quarter million dollars back to the company. The other odd thing was the company’s decision to buy back stock through additional borrowing despite already having $228.4 million in net debt on its balance sheet even after excluding capital leases.
The third thing I kept thinking about was my back of the envelope math on franchisee earnings. If on average revenue was $462,000 for franchisees, then a 25% operating margin works out to $115,500 in operating earnings before taxes and interest. This might be considered a well paying job by some folks in certain low cost areas but is hardly a business franchisees could get excited about.
A short seller report by Fuzzy Panda Research discusses the franchisee economics, calls the company a house of cards and raises questions about the credibility of the CEO. While I don’t know enough about Fuzzy Panda Research or their track record, the report is well worth reading to understand the other side of the trade if you consider going long the company.
In light of the short seller report that came out in June and the subsequent drop in the stock price, both the cluster insider buying and the stock buyback announcement start to make more sense.
Welcome to edition 695 of Insider Weekends. Insider buying increased last week with insiders purchasing $64.71 million of stock compared to $62.22 million in the week prior. Selling decreased to $1.09 billion compared to $1.43 billion in the week prior.
Sell/Buy Ratio: The insider Sell/Buy ratio is calculated by dividing the total insider sales in a given week by the total insider purchases that week. The adjusted ratio for last week dropped to 16.78. In other words, insiders sold almost 17 times as much stock as they purchased. This week, the Sell/Buy ratio was unfavorable, compared to the prior week when the ratio stood at 22.94.
Notable Insider Buys:
1. Sarepta Therapeutics, Inc. (SRPT): $111.89
Director Michael Andrew Chambers acquired 33,665 shares of this commercial-stage biopharmaceutical company, paying $108.47 per share for a total amount of $3.65 million. These shares were purchased indirectly through a trust.
You can view the list of recent insider transactions for Sarepta Therapeutics, Inc. here.
| P/E: -10.86 | Forward P/E: 26.27 | Industry P/E: 30.29 |
| P/S: 10.39 | Price/Book: 14.08 | EV/EBITDA: -21.63 |
| Market Cap: $10.42B | Avg. Daily Volume: 1,189,548 | 52 Week Range: $100.15 – $159.89 |
2. Precigen, Inc. (PGEN): $1.61
Shares of this gene and cellular therapies developer were acquired by 3 insiders:
You can view the list of recent insider transactions for Precigen, Inc. here.
| P/E: 15.97 | Forward P/E: -5.55 | Industry P/E: 30.29 |
| P/S: 18.61 | Price/Book: 2.47 | EV/EBITDA: -4.99 |
| Market Cap: $411.33M | Avg. Daily Volume: 1,604,935 | 52 Week Range: $0.81 – $2.9 |
3. Forward Air Corporation (FWRD): $64.58
Shares of this asset-light freight and logistics company were acquired by 10 insiders:
You can view the list of recent insider transactions for Forward Air Corporation here.
| P/E: 9.31 | Forward P/E: 12.4 | Industry P/E: 19.63 |
| P/S: 0.92 | Price/Book: 2.47 | EV/EBITDA: 7.38 |
| Market Cap: $1.68B | Avg. Daily Volume: 311,374 | 52 Week Range: $60.09 – $121.38 |
4. Option Care Health, Inc. (OPCH): $34.75
Shares of this home and alternate site infusion services provider were acquired by 2 insiders:
You can view the list of recent insider transactions for Option Care Health, Inc. here.
| P/E: 40.41 | Forward P/E: 28.48 | Industry P/E: 30.29 |
| P/S: 1.51 | Price/Book: 4.24 | EV/EBITDA: 20.43 |
| Market Cap: $6.25B | Avg. Daily Volume: 2,669,235 | 52 Week Range: $24.23 – $35.87 |
5. AerSale Corporation (ASLE): $12.61
Shares of this aftermarket commercial aircraft company were acquired by 6 insiders:
You can view the list of recent insider transactions for AerSale Corporation here.
| P/E: 25.22 | Forward P/E: 11.36 | Industry P/E: 19.67 |
| P/S: 2.2 | Price/Book: 1.44 | EV/EBITDA: 146.38 |
| Market Cap: $645.9M | Avg. Daily Volume: 537,862 | 52 Week Range: $10.39 – $21.76 |
6. Marqeta, Inc. (MQ): $5.72
Shares of this cloud-based open application programming interface platform were acquired by 2 insiders:
You can view the list of recent insider transactions for Marqeta, Inc. here.
| P/E: -15 | Forward P/E: -18.45 | Industry P/E: 9.63 |
| P/S: 3.66 | Price/Book: 2.23 | EV/EBITDA: -8.02 |
| Market Cap: $3.09B | Avg. Daily Volume: 5,450,648 | 52 Week Range: $3.46 – $8.63 |
7. Xponential Fitness, Inc. (XPOF): $21.81
Shares of this boutique fitness franchisor were acquired by 4 insiders:
You can view the list of recent insider transactions for Xponential Fitness, Inc. here.
| P/E: 472.08 | Forward P/E: 16.78 | Industry P/E: 16.55 |
| P/S: 3.89 | Price/Book: -20.88 | EV/EBITDA: 16.96 |
| Market Cap: $1.1B | Avg. Daily Volume: 1,131,688 | 52 Week Range: $14.51 – $33.58 |
You can view the full list of purchases from this Insider Buying page.
Notable Insider Sales:
1. Salesforce, Inc. (CRM): $204.83
Shares of this software application company were sold by 3 insiders:
You can view the list of recent insider transactions for Salesforce, Inc. here.
| P/E: 553.6 | Forward P/E: 22.78 | Industry P/E: 24.94 |
| P/S: 6.2 | Price/Book: 3.49 | EV/EBITDA: 29.9 |
| Market Cap: $199.5B | Avg. Daily Volume: 6,491,590 | 52 Week Range: $126.34 – $238.22 |
2. The Kraft Heinz Company (KHC): $33.66
Shares of Kraft Heinz were sold by 3 insiders:
You can view the list of recent insider transactions for The Kraft Heinz Company here.
| P/E: 17.17 | Forward P/E: 11.3 | Industry P/E: 21.26 |
| P/S: 1.52 | Price/Book: 0.83 | EV/EBITDA: 9.81 |
| Market Cap: $41.31B | Avg. Daily Volume: 7,712,161 | 52 Week Range: $32.73 – $42.8 |
3. The St. Joe Company (JOE): $58.63
Director Bruce R. Berkowitz sold 201,000 shares of this real estate development operator for $62.06, generating $12.47 million from the sale.
You can view the list of recent insider transactions for The St. Joe Company here.
| P/E: 50.54 | Forward P/E: 533 | Industry P/E: 25.94 |
| P/S: 10.68 | Price/Book: 5.15 | EV/EBITDA: 37.96 |
| Market Cap: $3.42B | Avg. Daily Volume: 219,929 | 52 Week Range: $31.11 – $65.99 |
4. Booz Allen Hamilton Holding Corporation (BAH): $113.77
Director Ralph W. Shrader sold 100,000 shares of this management and technology consulting provider for $120.56, generating $12.06 million from the sale. These shares were sold indirectly by a trust.
You can view the list of recent insider transactions for Booz Allen Hamilton Holding Corporation here.
| P/E: 56.04 | Forward P/E: 20.24 | Industry P/E: 19.67 |
| P/S: 1.54 | Price/Book: 14.67 | EV/EBITDA: 27.95 |
| Market Cap: $14.9B | Avg. Daily Volume: 927,511 | 52 Week Range: $87.99 – $125.19 |
5. Atlassian Corporation (TEAM): $186.3
Shares of this software application company were sold by 5 insiders:
You can view the list of recent insider transactions for Atlassian Corporation here.
| P/E: -89.14 | Forward P/E: 64.69 | Industry P/E: 24.94 |
| P/S: 13.55 | Price/Book: 73.23 | EV/EBITDA: -170.39 |
| Market Cap: $47.88B | Avg. Daily Volume: 1,885,112 | 52 Week Range: $113.855 – $267.58 |
6. The Liberty SiriusXM Group (LSXMA): $23.23
Shares of this entertainment company were sold by 2 insiders:
You can view the list of recent insider transactions for The Liberty SiriusXM Group here.
| P/E: 7.59 | Forward P/E: 7.8 | Industry P/E: 16.62 |
| P/S: 0.85 | Price/Book: 0.83 | EV/EBITDA: 9.25 |
| Market Cap: $7.58B | Avg. Daily Volume: 1,273,080 | 52 Week Range: $22.5 – $45.26 |
7. The Boston Beer Company, Inc. (SAM): $362.74
Founder & Brewer, Dogfish Head Samuel A. Calagione III sold 27,000 shares of this beverages company for $359.13, generating $9.69 million from the sale. These share were sold indirectly by Limited Partnership managed by the reporting person.
You can view the list of recent insider transactions for The Boston Beer Company, Inc. here.
| P/E: 73.13 | Forward P/E: 33.93 | Industry P/E: 21.26 |
| P/S: 2.16 | Price/Book: 4.04 | EV/EBITDA: 21.2 |
| Market Cap: $4.45B | Avg. Daily Volume: 137,666 | 52 Week Range: $296.27 – $422.75 |
You can view the full list of sales from this Insider Sales page.
Disclaimer: Please do your own due diligence before buying or selling any securities mentioned in this article. We do not warrant the completeness or accuracy of the content or data provided in this article.