- Subscribe
- Premium
- C-Suite
- Insiders
- M&A
- Gurus
- Spinoffs
- Buybacks
- More
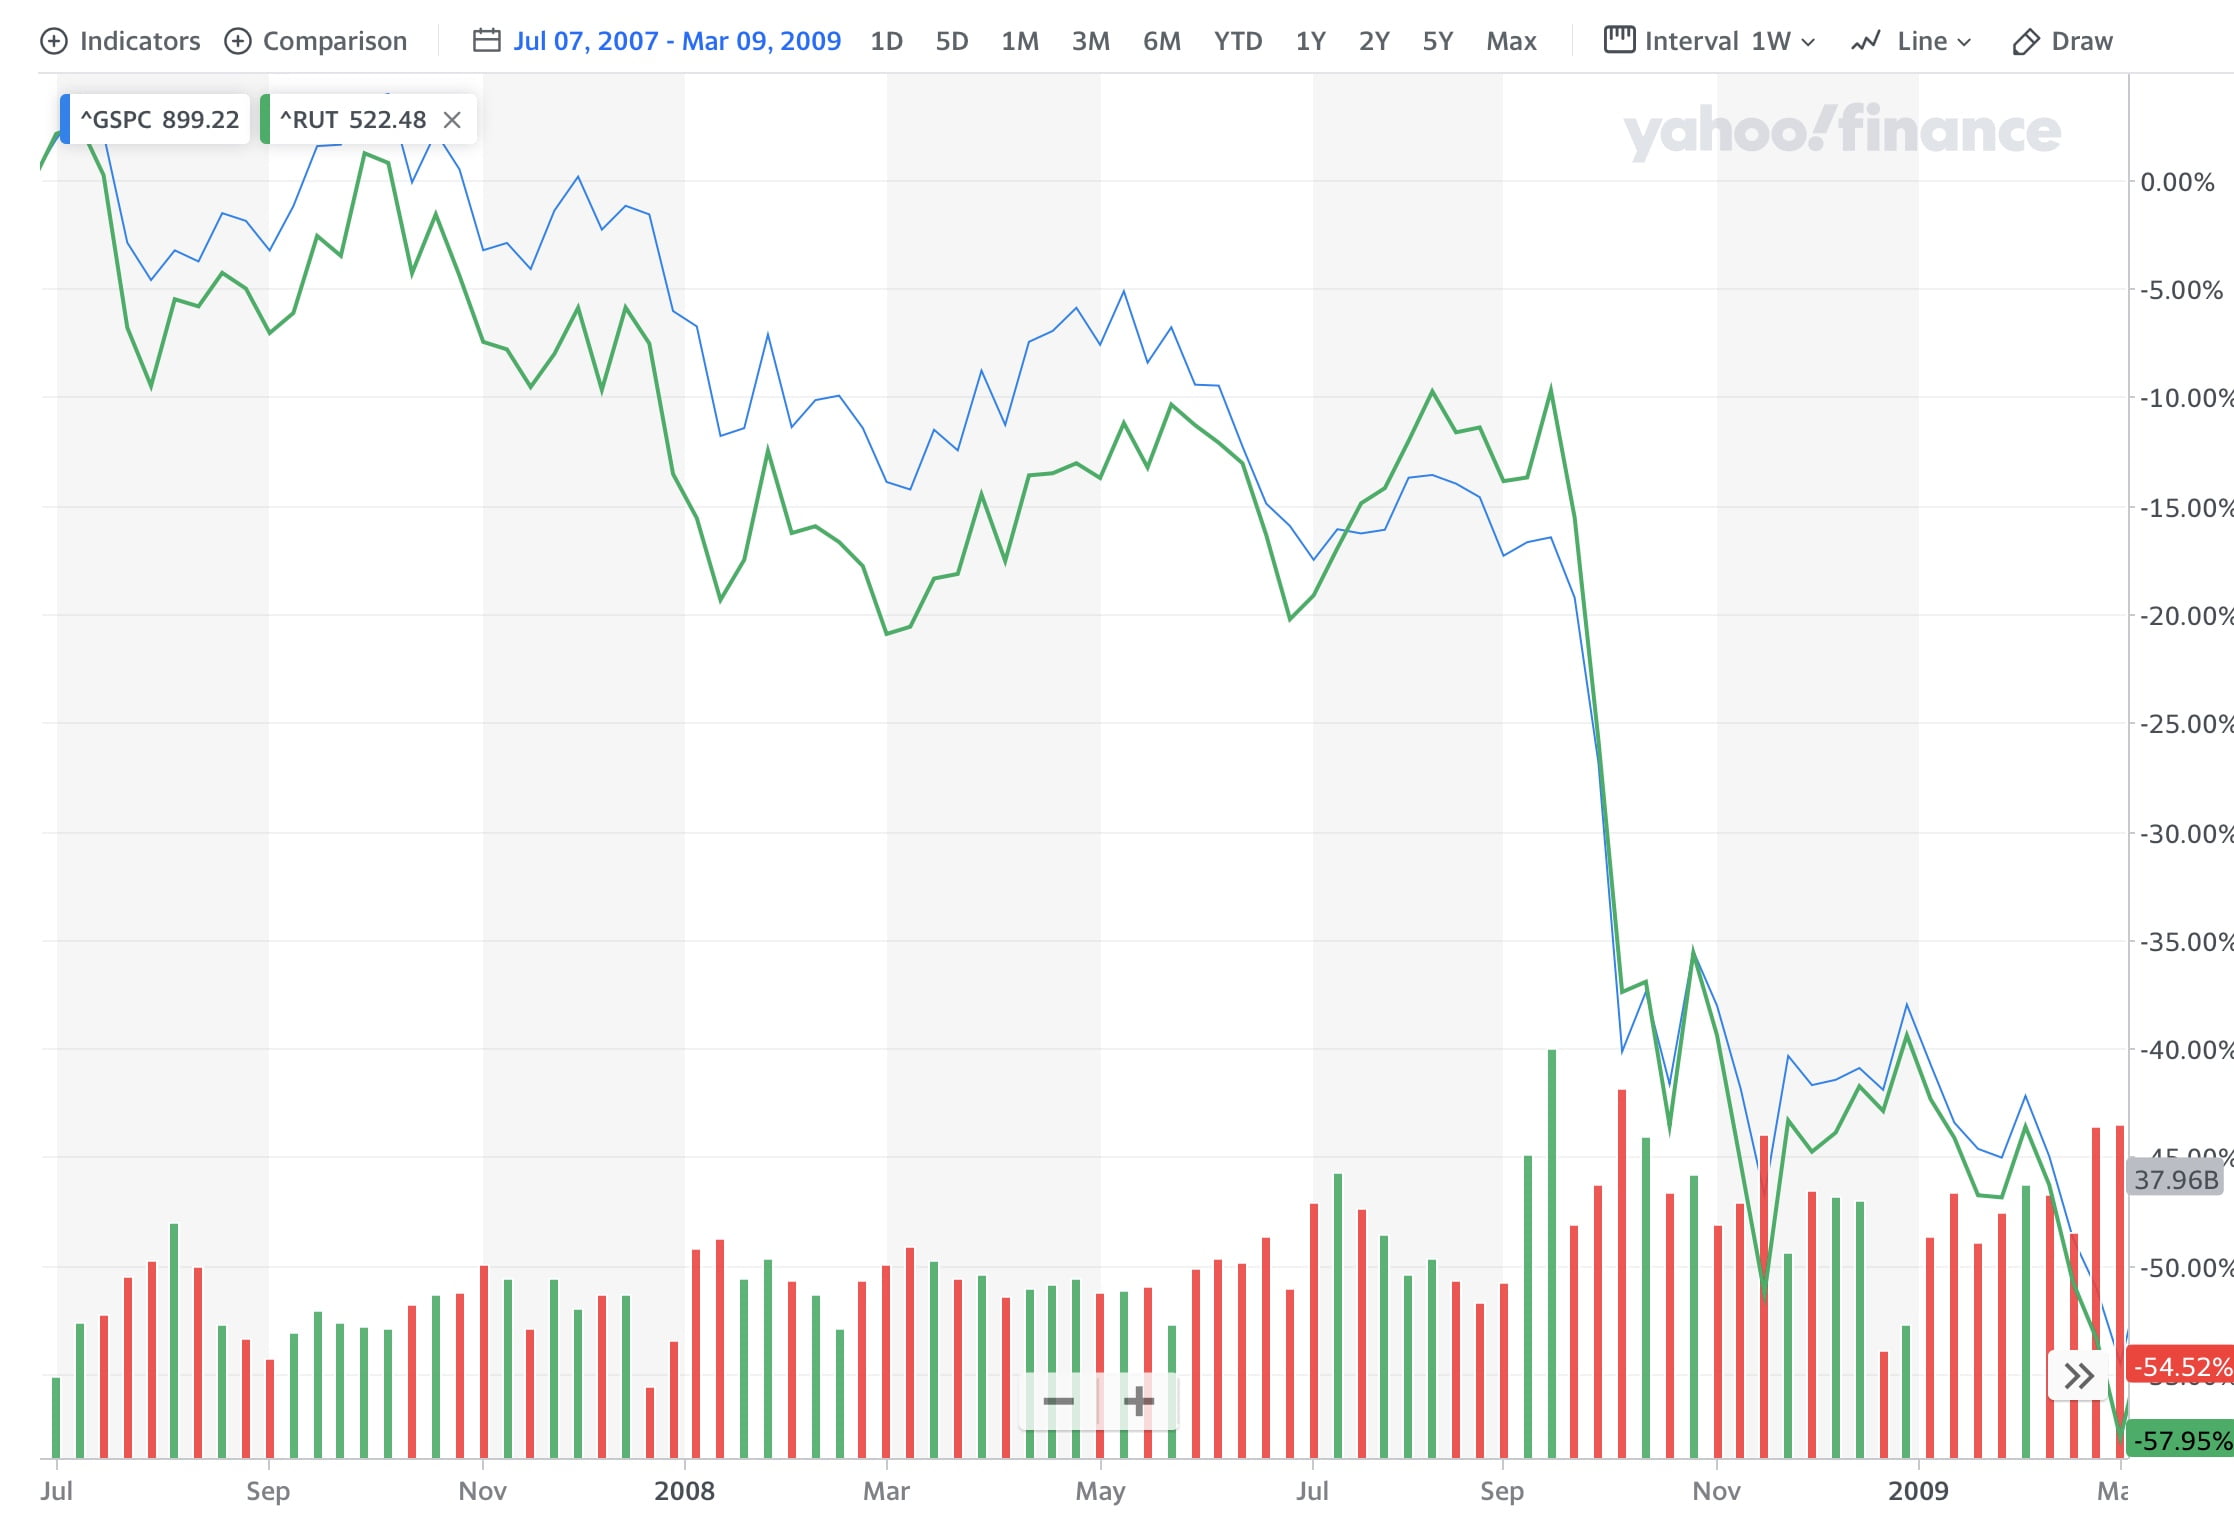
The housing crisis in 2007 and 2008 that trigged the Great Recession was brutal for equity investors. Most major market indexes including the S&P 500 suffered peak to trough drops of as much as 57% over a 20 month period. Put another way, more than half of your portfolio was wiped out in less than 2 years as you can see from the chart below.
I was listening to a Masters in Business podcast where Barry Ritholtz was interviewing the legendary investor Bill Miller. If you are not familiar with Bill Miller, he ran Legg Mason’s Capital Management Value Trust mutual fund, which beat the S&P 500 for 15 consecutive years from 1991 to 2005. This was a remarkable feat considering this period spanned both the dot com bubble and the deep bear market that followed after the bubble burst.
The 2007-2009 bear market was not kind to Bill Miller as he doubled down on a bet on financial and housing stocks by buying more as they kept declining. He was hoping that they will eventually recover and reward his investors handsomely. He probably did not anticipate the depths of that bear market and the housing sector was hit harder than the market indexes. He ended up losing both his investors a lot of money and eventually his position at Legg Mason as outlined in the Wall Street Journal article The Stock Picker’s Defeat. There is a reason “letting your winners run and not averaging your losers” is part of investing canon. This might also explain why Bill Miller also tends to reread the 1923 book Reminiscences of a Stock Operator every year.
Bill Miller came out of that debacle and once again started outperforming the S&P 500 in the last few years. One exchange from his interview with Barry Ritholtz stood out to me. I have reproduced the exchange below.
RITHOLTZ: Let me ask about ’08-’09, why did value underperform heading into the financial crisis and what was it that so many people missed in the spreadsheet that was evidenced if you look at books like the Big Short or the movie or just how crazy the home flipping epidemic had become, why was it so challenging to see that if you were looking at balance sheets as opposed to the real estate listings?
MILLER: Yes. I’d say this. There’s a line that Charlie Munger, Warren Buffett’s partner said in 2009 because he had just hired Todd and Ted to come start managing money for Berkshire maybe a year or two earlier. And they were asked at the annual meeting, did the guys that you hire, did they outperform in this — in this bear market.
And Buffett said no, they underperformed and somebody said, well, what — what do you think they did wrong or the implication of where they messed things up and Charlie Munger said — he said, well, he says the way that I looked at this, he says, I think market estimated (ph) was down 38 percent or something we got in 2008.
Charlie said, in my view, he said if you weren’t down at least 45 percent then you didn’t know what you were doing. It was a clever line. And I think that the issue that — in retrospect that I looked at was that here were structural things that I missed. The stock market never got really expensive in the sense of 20 or 25 times earnings and expensive relative to rates.
Charlie Munger, the billionaire author of Poor Charlie’s Almanac and Warren Buffett’s long-term partner is credited for getting Buffett to start paying up for great businesses instead of sticking to a strictly value oriented investment strategy.
That clever line by Munger, “if you weren’t down at least 45 percent then you didn’t know what you were doing” is very insightful. It implies that if you were not down a lot during that time, you were not taking enough risk by investing in the stock market or had gotten lucky timing the market. Both of these things could lead to short-term positive outcomes at the cost of long-term underperformance.
The stock market is often the best performing asset class over long periods of time returning on average 9% a year including dividends. However this extra return comes with a lot of volatility. The market could wipe off half your assets in a single year or not do much for almost a full decade. Investors that want the extra returns from stocks also have to accept the inevitable bear markets and downturns and stay invested through them. The big mistake is to attempt to time the market. You have to get two decisions right: i) when to get out and ii) when to get back in. Even the best forecasters are right only about 60 to 65% of the time.
This is what Munger means when he says “if you weren’t down at least 45 percent then you didn’t know what you were doing”. Obviously staying 100% invested in stocks may not be the best strategy for all investors depending on when they might need money for big expenses, funding a retirement, etc. There are other asset classes like real estate investment trusts (REITs) and commodities that have done very well over long periods of time. Which is why a “permanent portfolio”, which distributes assets equally between stocks, bonds, gold and cash has been shown to perform almost as well as the stock market with lower drawdowns over long periods of time.
The bottom line is that the biggest risk to your portfolio is becoming very risk averse and missing out on the upside the stock market provides most decades.
Editor’s note: This article was originally published on our sister site PowerCompounding.com and is being reproduced on Inside Arbitrage with minimal edits.