
Welcome to edition 344 of Insider Weekends. Insider buying increased last week with insiders buying $32.72 million of stock compared to $27.16 million in the week prior. Selling declined with insiders selling $425.47 million of stock last week compared to $497.16 million in the week prior.
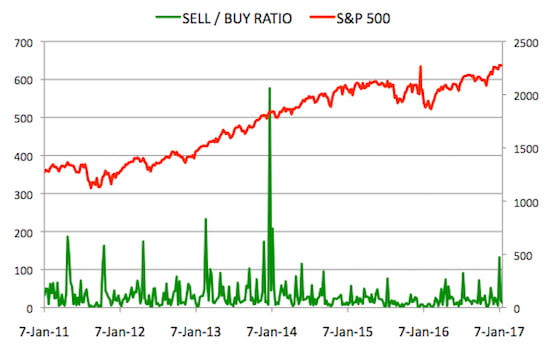
Sell/Buy Ratio: The insider Sell/Buy ratio is calculated by dividing the total insider sales in a given week by total insider purchases that week. The adjusted ratio for last week dropped to 13. In other words, insiders sold 13 times as much stock as they purchased. The Sell/Buy ratio this week compares favorably with the prior week, when the ratio stood at 18.31.
Note: As mentioned in the first post in this series, certain industries have their preferred metrics such as same store sales for retailers, funds from operations (FFO) for REITs and revenue per available room (RevPAR) for hotels that provide a better basis for comparison than simple valuation metrics. However metrics like Price/Earnings, Price/Sales and Enterprise Value/EBITDA included below should provide a good starting point for analyzing the majority of stocks.
Notable Insider Buys:
1. American Outdoor Brands Corporation (AOBC): $20.13
President and CEO P. James Debney acquired 25,000 shares of this firearm products and accessories manufacturer, paying $20.50 per share for a total amount of $512,400. Mr. Debney increased his stake by 6.79% to 393,272 shares with this purchase.
This is the second week in a row that the company formerly known as Smith & Wesson Holding made our list on account of Mr. Debney’s purchases. In an odd twist, AOBC is down nearly 30% since the presidential election and is trading close to a 52 week low. The stock was up more than 400% in the prior four years.
You can view the list of recent insider transactions for American Outdoor Brands Corporation here.
| P/E: 8.48 | Forward P/E: 8.64 | Industry P/E: N/A |
| P/S: 1.31 | Price/Book: 3.03 | EV/EBITDA: 4.87 |
| Market Cap: $1.13B | Avg. Daily Volume: 2,250,760 | 52 Week Range: $20.02 – $22.21 |
2. Sinclair Broadcast Group, Inc. (SBGI): $32.25
Executive Chairman David D. Smith acquired 16,500 shares of this TV broadcasting company, paying $29.59 per share for a total amount of $488,265. These shares were purchased indirectly by various trusts and entities.
In an era defined by “cord cutting”, Sinclair has managed to more than double its revenue over the last four years while posting modest earnings growth. The stock appears to be reasonably valued and sports a dividend yield of 2.23% with a payout ratio of 35.76.
You can view the list of recent insider transactions for Sinclair Broadcast Group, Inc. here.
| P/E: 16.88 | Forward P/E: 13.72 | Industry P/E: 18.41 |
| P/S: 1.12 | Price/Book: 5.58 | EV/EBITDA: 9.13 |
| Market Cap: $2.92B | Avg. Daily Volume: 1,234,970 | 52 Week Range: $24.15 – $34.85 |
3. WPX Energy, Inc. (WPX): $13.71
Shares of this independent oil and natural gas exploration and production company were acquired by 3 insiders:
You can view the list of recent insider transactions for WPX Energy, Inc. here.
| P/E: N/A | Forward P/E: N/A | Industry P/E: 3.29 |
| P/S: 3.44 | Price/Book: 1.41 | EV/EBITDA: 20.66 |
| Market Cap: $5.34B | Avg. Daily Volume: 8,381,260 | 52 Week Range: $3.51 – $16.17 |
4. Opko Health, Inc. (OPK): $8.64
CEO & Chairman Phillip Frost M.D. acquired 45,700 shares of this devices and drug development company, paying $8.91 per share for a total amount of $407,123. These shares were purchased indirectly by Frost Gamma Investments Trust.
You can view the list of recent insider transactions for Opko Health, Inc. here.
| P/E: N/A | Forward P/E: N/A | Industry P/E: 35.85 |
| P/S: 3.99 | Price/Book: 2.32 | EV/EBITDA: 47.16 |
| Market Cap: $4.82B | Avg. Daily Volume: 4,667,080 | 52 Week Range: $7.42 – $12.15 |
5. IHS Markit Ltd. (INFO): $38.79
Director Robert P. Kelly acquired 10,000 shares of this business services company, paying $38.62 per share for a total amount of $386,200. Mr. Kelly increased his stake by 17.25% to 67,964 shares with this purchase.
You can view the list of recent insider transactions for IHS Markit Ltd. here.
| P/E: 80.98 | Forward P/E: 16.16 | Industry P/E: N/A |
| P/S: 5.81 | Price/Book: 1.96 | EV/EBITDA: 24.88 |
| Market Cap: $16.14B | Avg. Daily Volume: 2,647,770 | 52 Week Range: $26.29 – $38.82 |
You can view the full list of purchases from this Insider Buying page.
Notable Insider Sales:
1. Facebook, Inc. (FB): $127.04
Shares of Facebook were sold by 2 insiders:
You can view the list of recent insider transactions for Facebook, Inc. here.
| P/E: 48.97 | Forward P/E: 24.53 | Industry P/E: 27.43 |
| P/S: 14.9 | Price/Book: 6.78 | EV/EBITDA: 26.43 |
| Market Cap: $366.15B | Avg. Daily Volume: 22,944,600 | 52 Week Range: $94.23 – $133.5 |
2. The Goldman Sachs Group, Inc. (GS): $232.2
President and Co-COO; CFO Harvey M. Schwartz sold 25,000 shares of Goldman Sachs for $233.99, generating $5.85 million from the sale.
You can view the list of recent insider transactions for The Goldman Sachs Group, Inc. here.
| P/E: 18.63 | Forward P/E: 10.65 | Industry P/E: 14.25 |
| P/S: 3.26 | Price/Book: 1.28 | EV/EBITDA: N/A |
| Market Cap: $97.25B | Avg. Daily Volume: 4,167,240 | 52 Week Range: $138.2 – $247.77 |
3. Apple Inc. (AAPL): $120
Shares of Apple were sold by 2 insiders:
You can view the list of recent insider transactions for Apple Inc. here.
| P/E: 14.44 | Forward P/E: 11.88 | Industry P/E: 19.1 |
| P/S: 2.96 | Price/Book: 4.98 | EV/EBITDA: 9.34 |
| Market Cap: $630.94B | Avg. Daily Volume: 31,411,400 | 52 Week Range: $89.47 – $120.5 |
4. Concho Resources Inc. (CXO): $136.15
Exec VP & Chief Operating Officer E. Joseph Wright sold 28,000 shares of this oil & gas exploration company for $135.15, generating $3.78 million from the sale.
You can view the list of recent insider transactions for Concho Resources Inc. here.
| P/E: N/A | Forward P/E: 648.33 | Industry P/E: 4.97 |
| P/S: 12.64 | Price/Book: 2.64 | EV/EBITDA: 22.01 |
| Market Cap: $19.76B | Avg. Daily Volume: 1,484,590 | 52 Week Range: $80.46 – $147.55 |
5. Hawaiian Holdings, Inc. (HA): $55.75
President and CEO Mark B. Dunkerley sold 58,000 shares of this airline company for $56.66, generating $3.29 million from the sale.
You can view the list of recent insider transactions for Hawaiian Holdings, Inc. here.
| P/E: 11.24 | Forward P/E: 11.52 | Industry P/E: N/A |
| P/S: 1.23 | Price/Book: 4.43 | EV/EBITDA: 4.85 |
| Market Cap: $2.98B | Avg. Daily Volume: 715,955 | 52 Week Range: $30.65 – $60.9 |
You can view the full list of sales from this Insider Sales page.
Disclaimer: Please do your own due diligence before buying or selling any securities mentioned in this article. We do not warrant the completeness or accuracy of the content or data provided in this article.
Connect with me on LinkedIn: http://www.linkedin.com/in/asifsuria or follow me on Twitter @asifsuria